This Center for Literacy infographic visualizes one year of impact really well
 February 25, 2016
Category: Results, Short
February 25, 2016
Category: Results, Short
Here’s a tip: If you want people to understand your organization’s annual report, create a nifty infographic to accompany it.
The Center for Literacy just did that. Their infographic (below) gives interested parties a comprehensive, easily digestible, straight-to-the-point peek at some of the more pertinent impact metrics they’ve tracked over the course of a year.
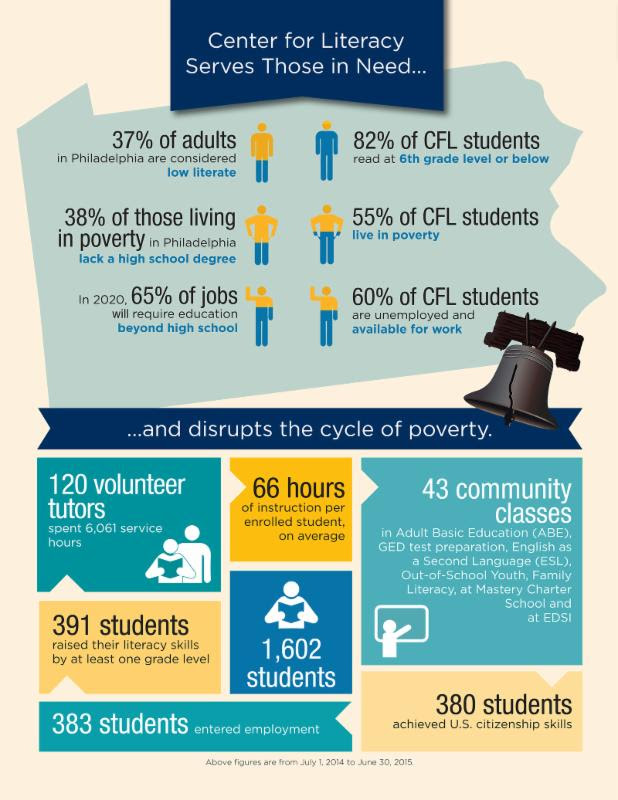
Hear that? That’s your brain saying “thank you.”
CFL’s annual report provides a number of personal stories that add color and context to those numbers, but a visually appealing infographic can make for a serious value-add.
We’ll see how those numbers look next year: On March 1, the Mayor’s Commission on Literacy will be opening a new myPLACE (Philadelphia Literacy and Adult Career Education) campus inside CFL.
Trending News

100 Days With No Plan, Delaware County Residents Want More Valerie Dowret

Government Can’t Save Us, But, Don’t Hurt Us: Philly to Harrisburg Jude Husein

Monday Minute with Tara Felicia Jones Monique Curry-Mims

Skin In The Game Andre Simms

Empowerment and Opportunity for All Monique Curry-Mims


6 things we know about you
Read More >
Pew's data dashboard offers a real-time glimpse of Philly’s economy
Read More >