Philly Police just released some important public safety data
 April 27, 2016
Category: Featured, Results, Short
April 27, 2016
Category: Featured, Results, Short
On the margins of Philadelphia, the city’s impoverished neighborhoods are bleeding.
The relationship between race, socioeconomic status and law enforcement is unstable, and the Philadelphia Police Department (PPD) wants to start holding itself accountable for the actions of its officers.
That’s why PPD recently released data on crime incidents, shooting victims and police stops in conjunction with the Police Data Initiative, a White House-led push to improve transparency in local law enforcement across the country.
https://twitter.com/PhilaGovData/status/725047453641281536
Led by PPD Director of Research and Analysis Kevin Thomas and released through the city’s data portal OpenDataPhilly, the postings include interactive visualizations that add some context to the numbers.
View the dataThe data reveal some stark realities about race, poverty, crime and law enforcement in Philadelphia.
For example, here’s one side of a visualization mapping poverty levels throughout Philadelphia that was posted with the data:
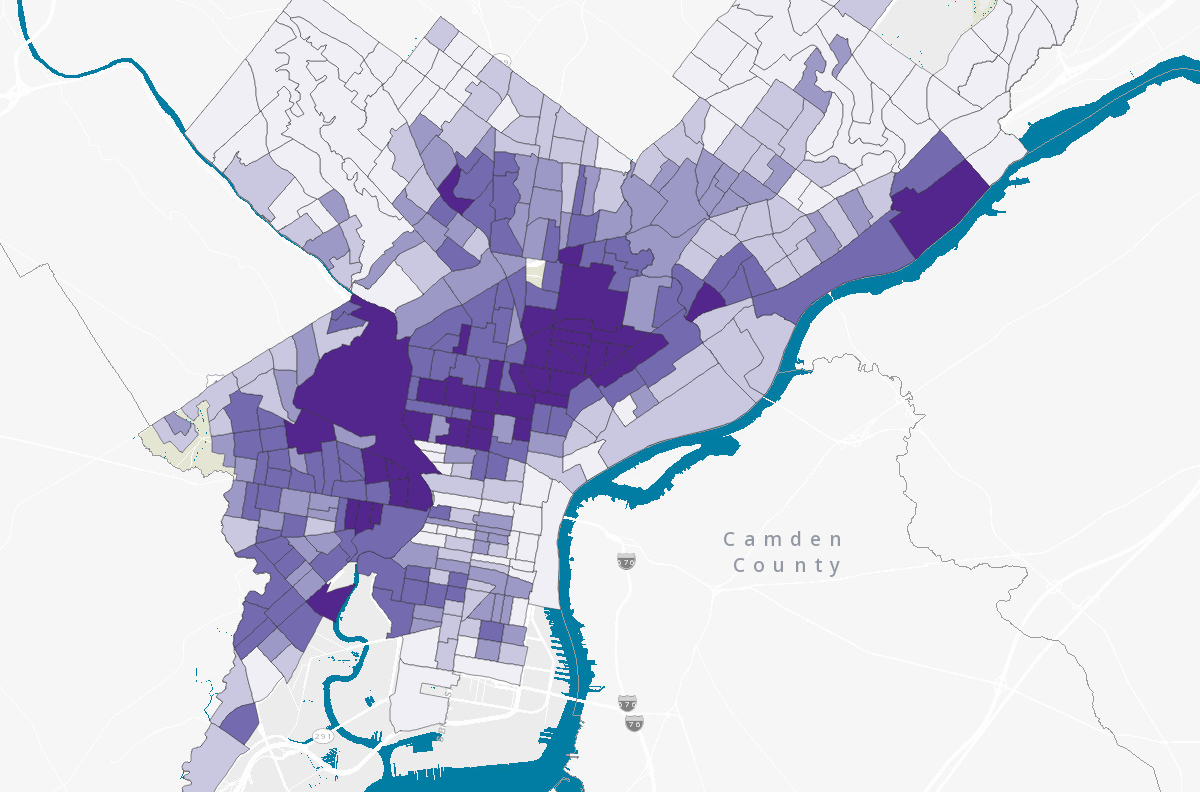
Map showing poverty levels.
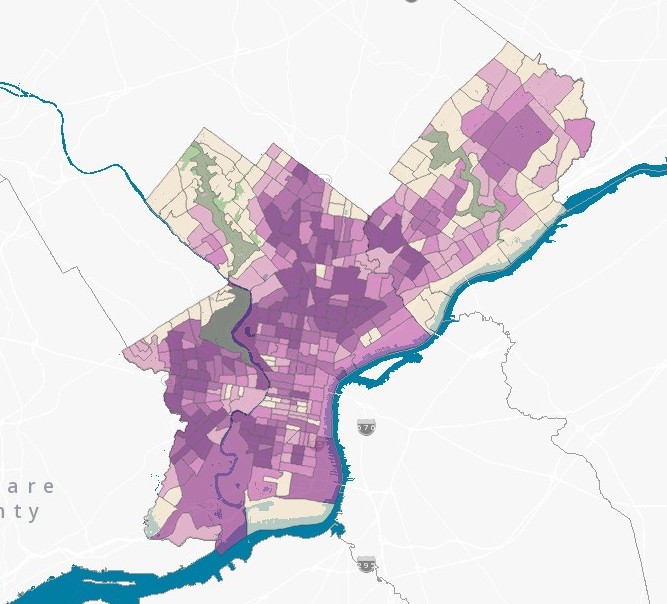
And here’s the other side of that visualization, mapping the city’s racial minority population:
Map showing racial minority population.
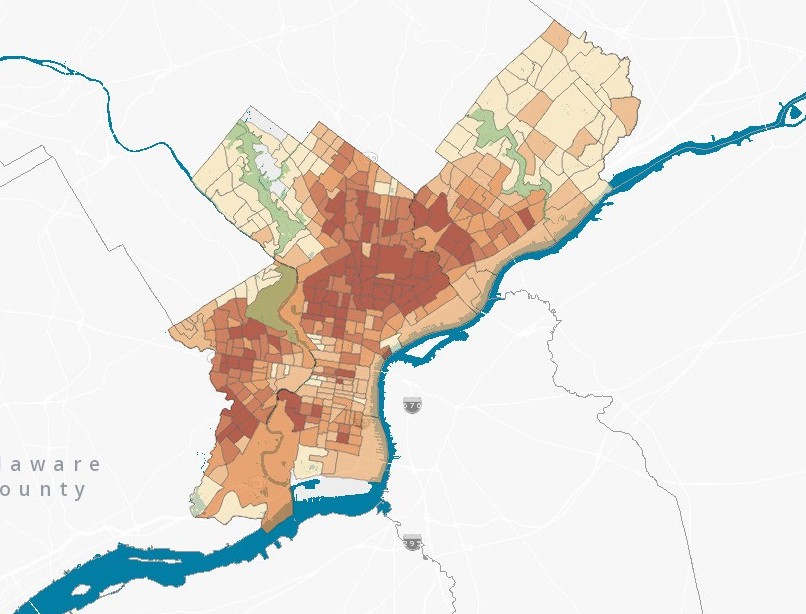
And a map of where pedestrian/vehicle stops are concentrated in the city.
Pedestrian/vehicle stops in Philadelphia.
“The question is often raised about whether a specific racial or ethnic group is over represented in pedestrian and vehicle stop,” reads a Police Data Initiative post. “On the surface, a cursory examination of the racial distribution of the pedestrian and vehicle stops, may suggest this is the case.”
Here’s what the racial breakdown of pedestrian/vehicle stops between 2014 and now looks like on the surface:
- 714,000 Black
- 231,000 White
- 92,700 Latino
- 23,400 Asian
PPD affirms the data only show a “partial picture” and that the practice of stop and frisk is not condoned within the department. But officers do practice “ped stops” allowing them to stop individuals and conduct a weapons search if they have “reasonable suspicion to believe that the person stopped is armed.”
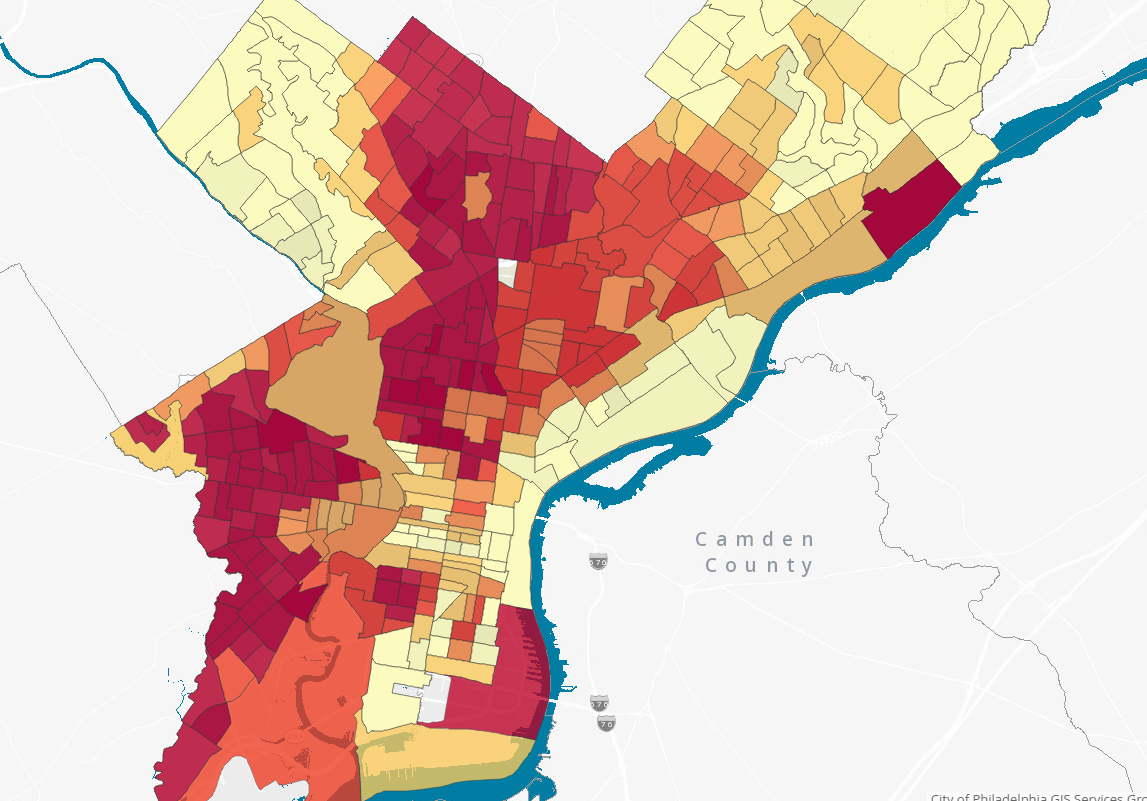
Are those suspicions justified? Here’s a map of where violent crime has happened over the past two years (and here’s a map of gun violence).
Violent crime in Philadelphia.
“Crime does not occur in a vacuum,” reads a Police Data Initiative post.
According to the visuals above, the post is right. Crime doesn’t exist in one vacuum in Philadelphia. It exists in three: North, West and Southwest Philadelphia, where a socioeconomic pull of gravity keeps crime in neighborhoods.
Project
OpenDataPhillyTrending News


Delco Businesses Hit Snag in Quest for Equitable County Contracts
Read More >
Why Philanthropy Can't Overlook the Mayoral Primaries
Read More >