Graphic explainer: A cartoonist unpacks the 2020 census
 December 4, 2019
Category: Featured, Purpose, Short
December 4, 2019
Category: Featured, Purpose, Short

Disclosures
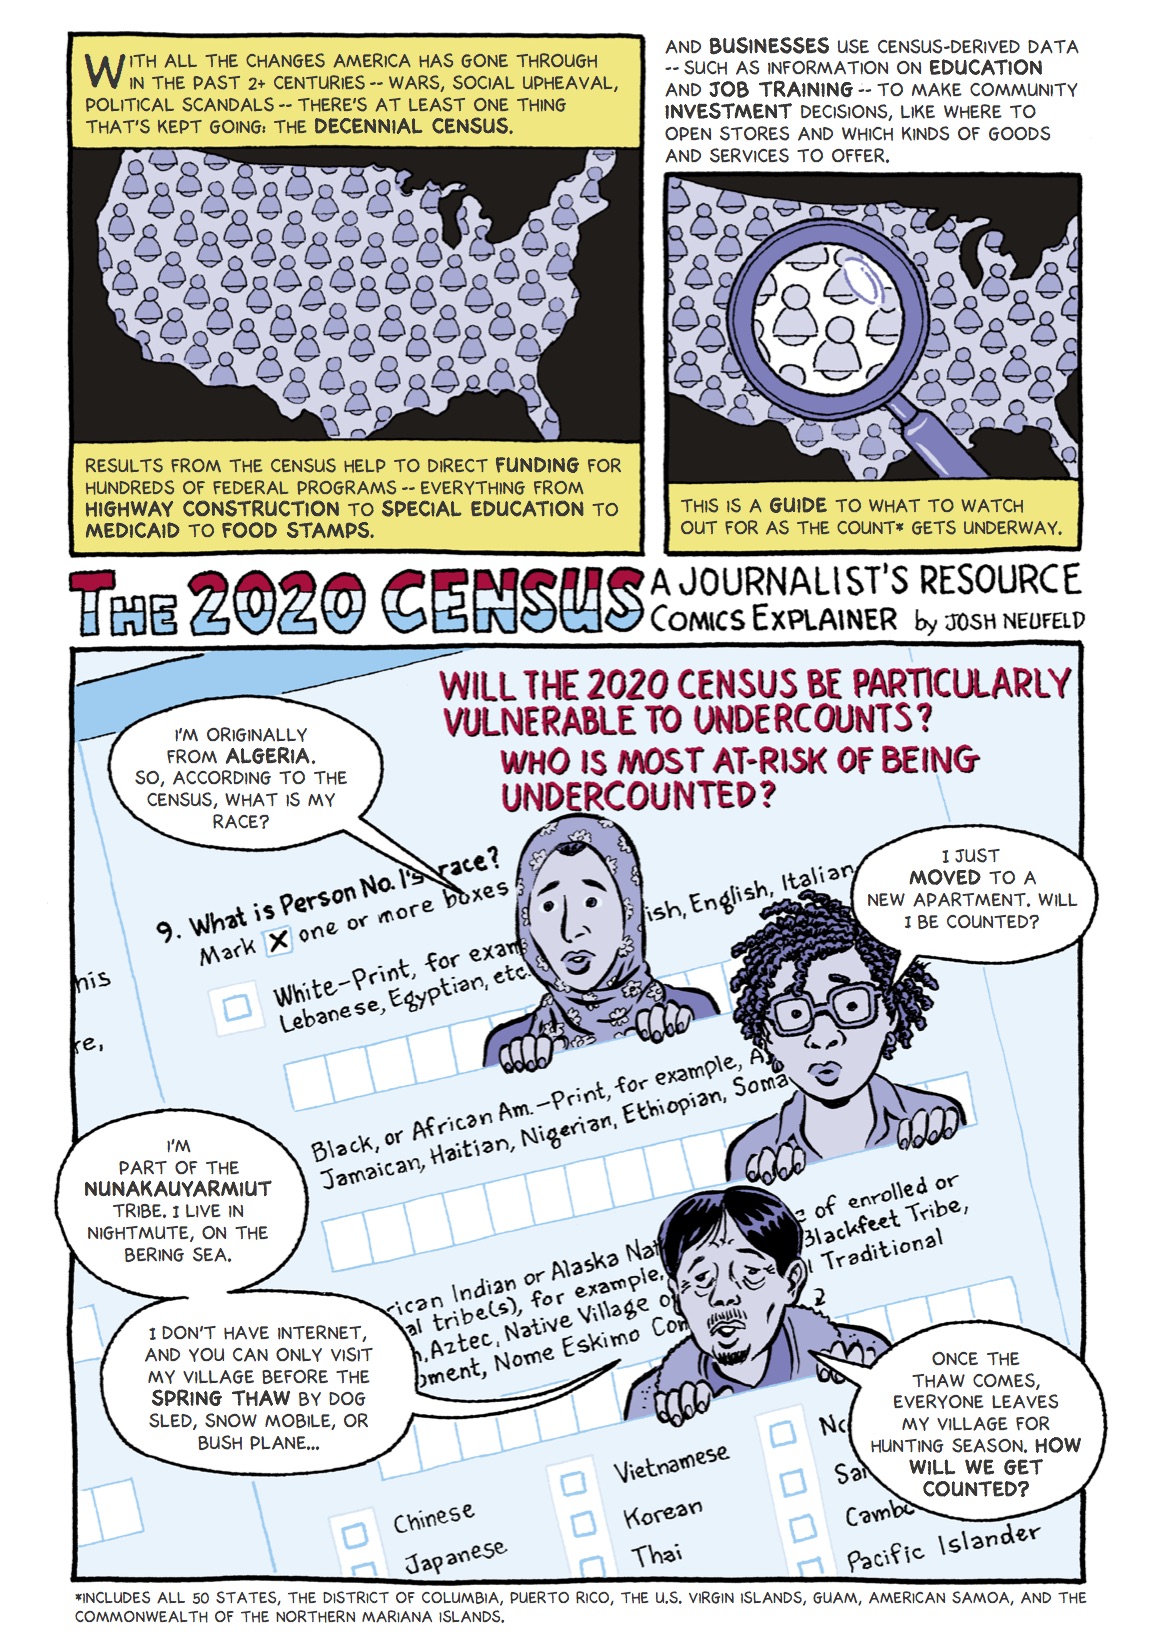
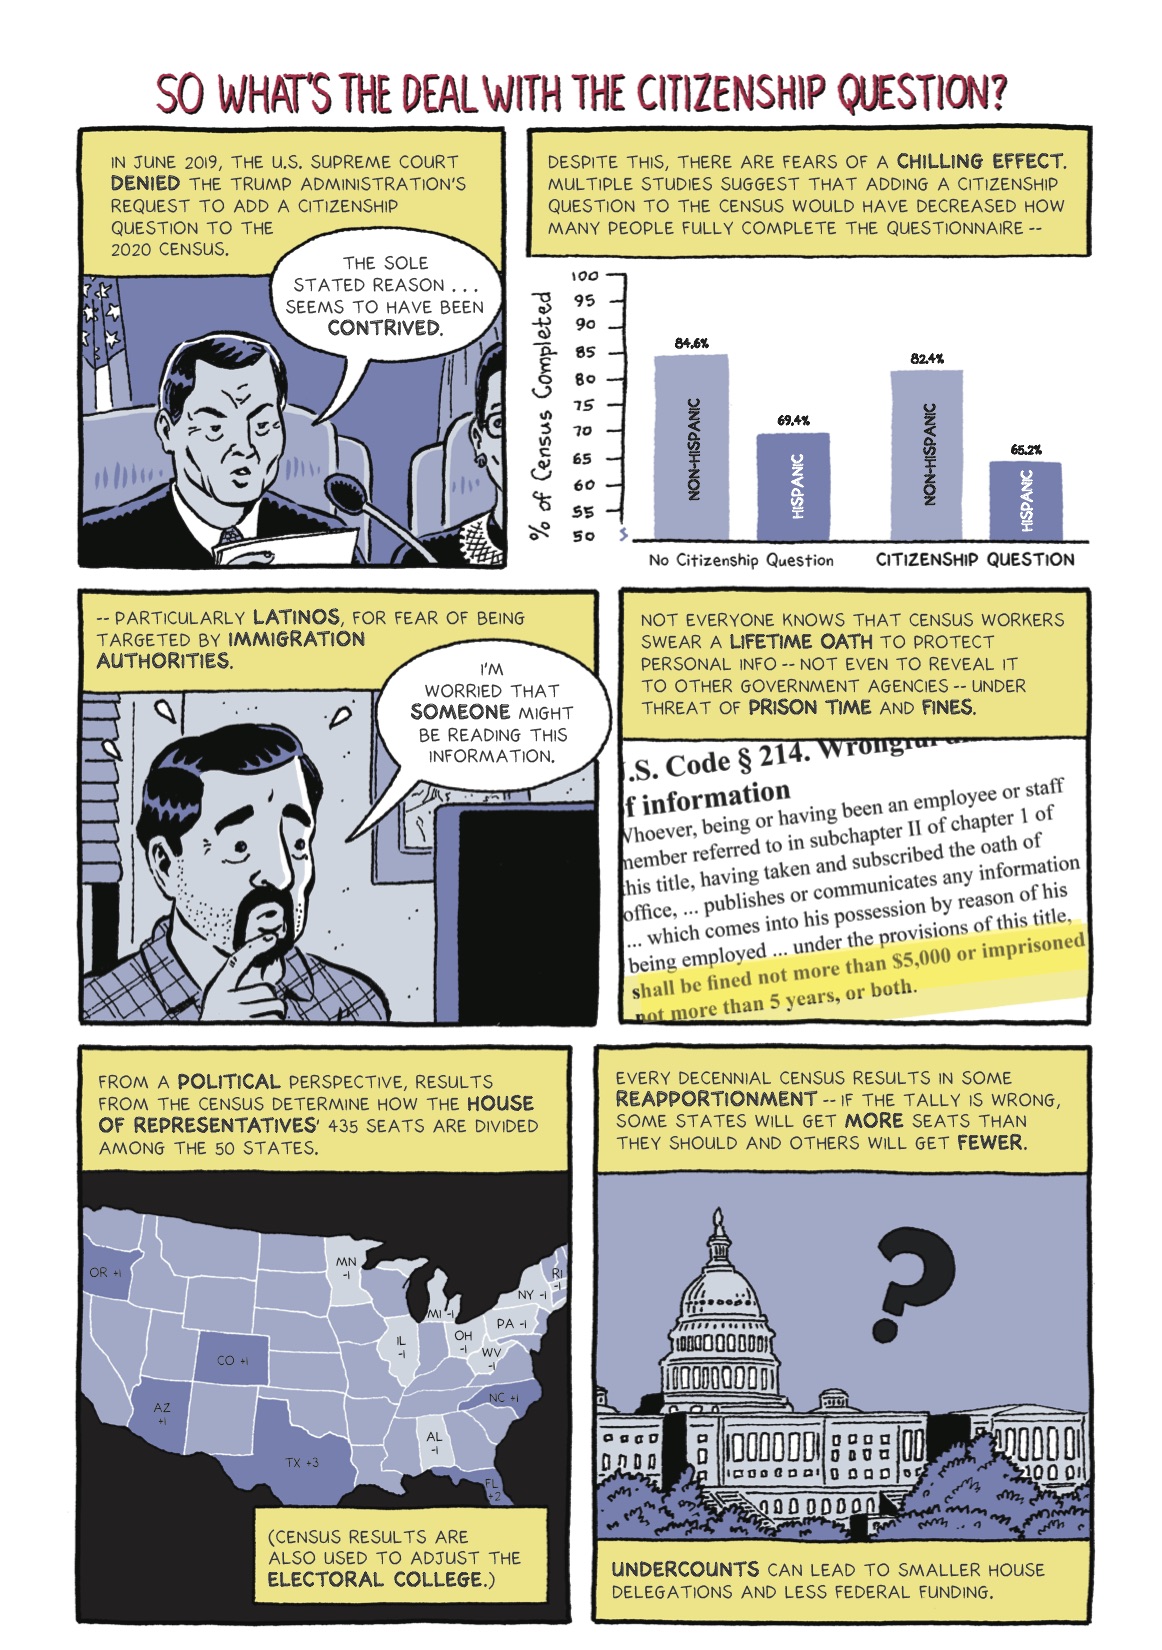
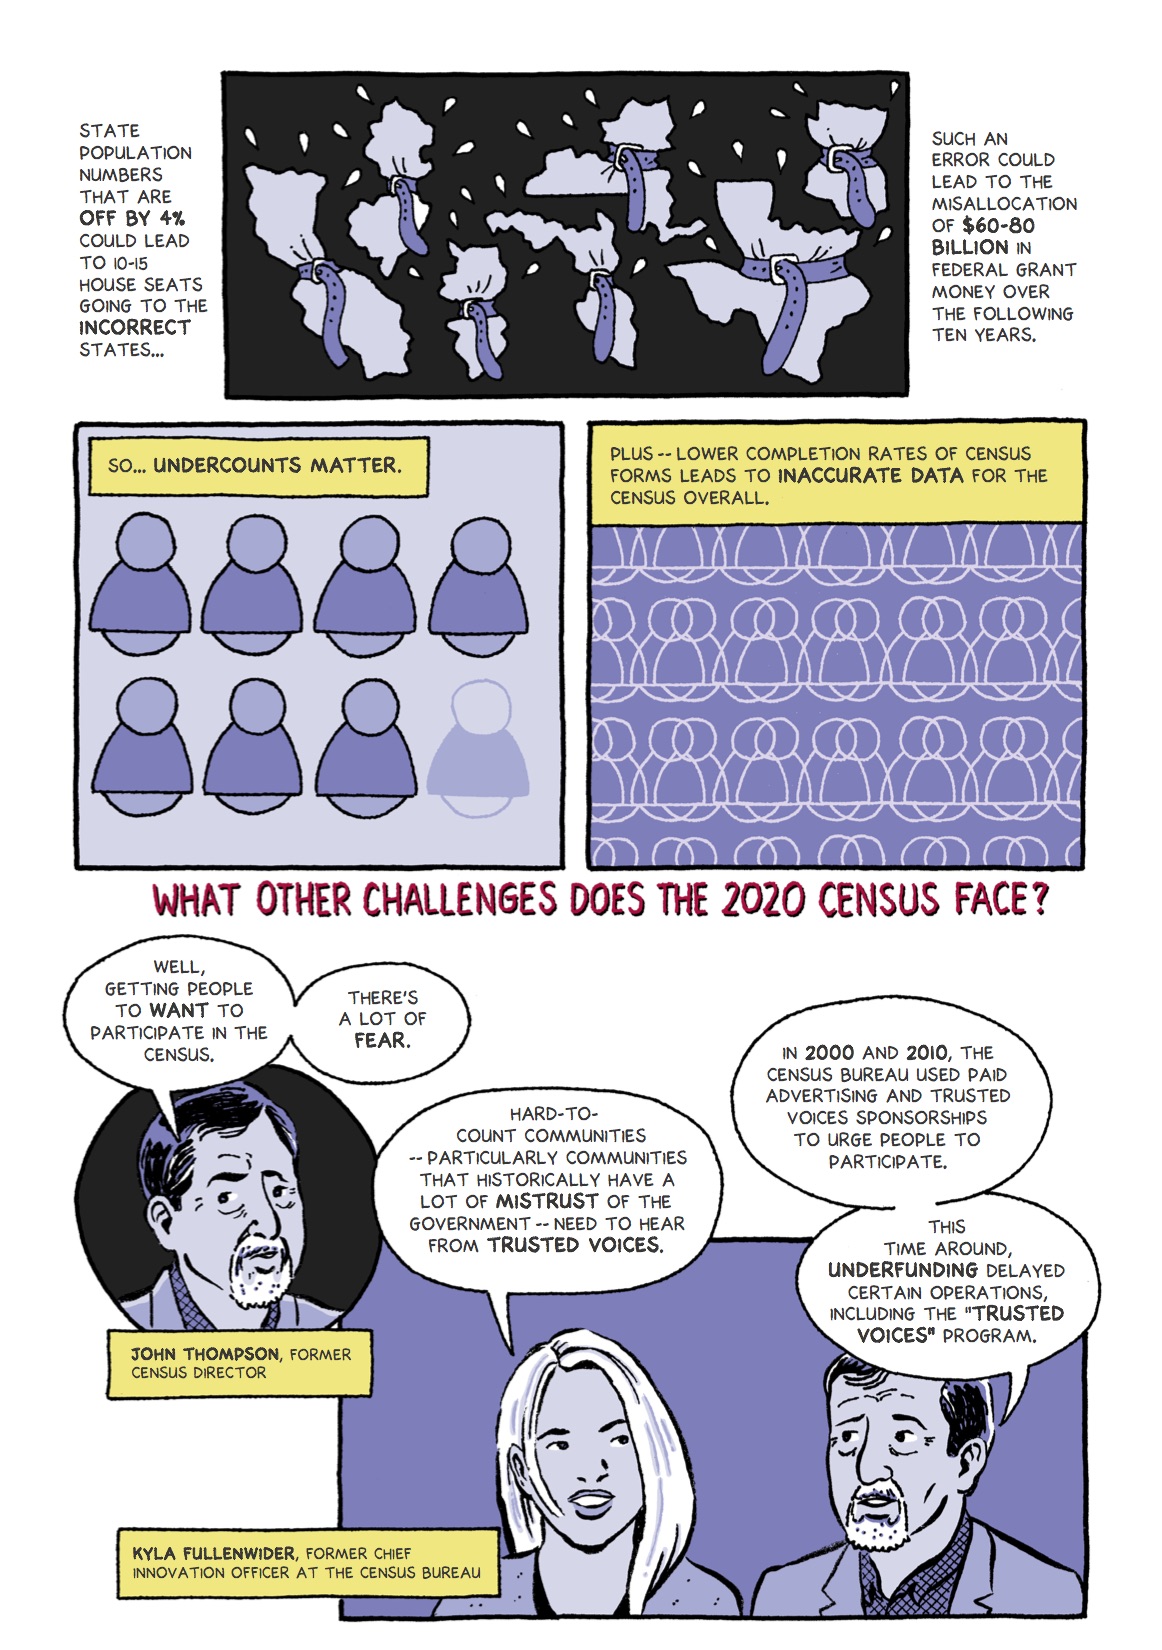
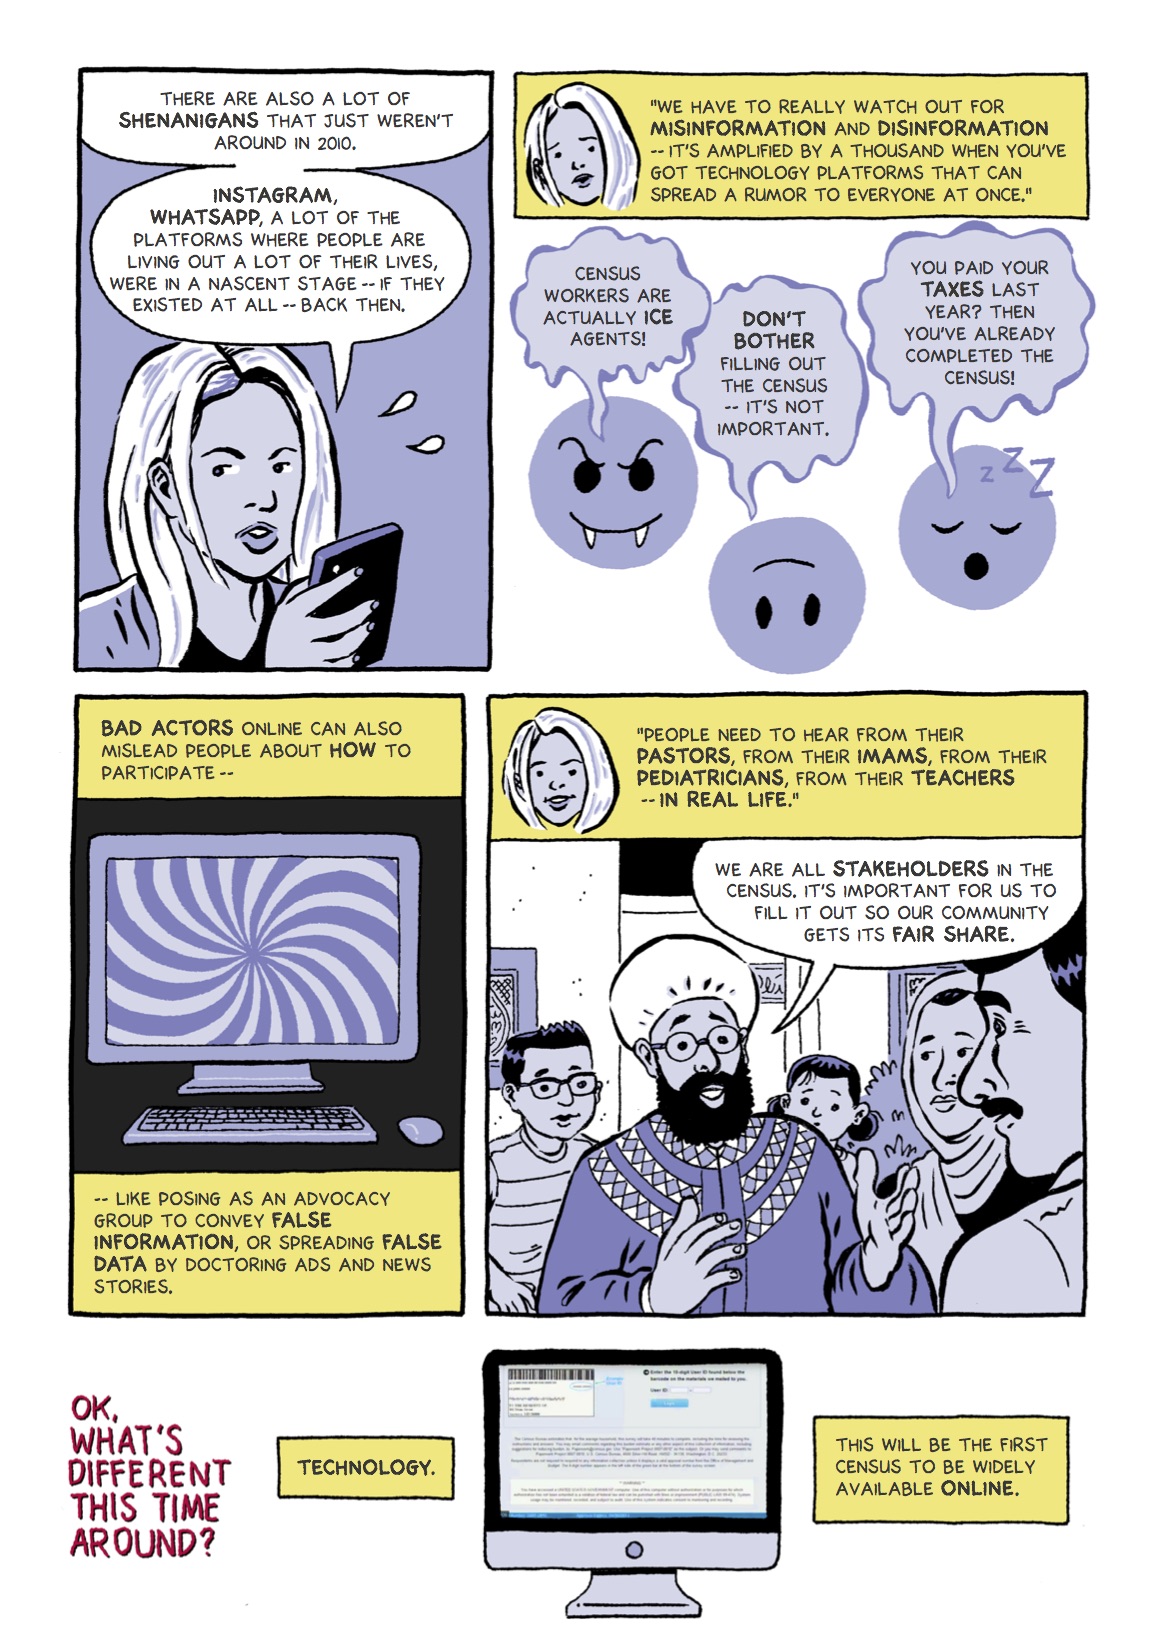
This article first appeared on Journalist's Resource and is republished here under a Creative Commons license.Editor’s note: Keystone Counts has identified 1.2 million Pennsylvania households in 24 counties at high risk for a Census undercount, so readily available sources of information are key to ensure accuracy. In this graphic explainer, cartoonist Josh Neufeld has outlined issues to watch for as the 2020 census gets underway, especially the risk of undercounts and miscounts.
The downloadable resource from Journalist’s Resource — a project of Harvard Kennedy School’s Shorenstein Center and the Carnegie-Knight Initiative, which curates, summarizes and contextualizes high-quality research on newsy public policy topics — is thus an especially helpful resource. It is licensed under a Creative Commons Attribution-NoDerivatives 4.0 International License, so educators, service providers, journalists and anyone else who would like to republish and share it it can do so.


Trending News


A Generocity update, and our 2023 editorial calendar
Read More >
Scribe explores oral history in 'Power Politics' series, funds emerging media makers
Read More >