Public Safety by the Numbers
 June 7, 2023
Category: Explainer, Feature, Featured, Short
June 7, 2023
Category: Explainer, Feature, Featured, Short

Updates
updated 6/8/2023 at 8:08 am to include PEW 2016 report link.In 2016, there was a shift. According to the State of the City 2016 report from PEW, the top concern of Philadelphia residents changed significantly: in February 15, the top concern was K-12 education; in August 2016, it was public safety. Seven years later, public safety is at the top of every conversation, survey, and concern from residents and policymakers.
While one may easily point to crime as a concern for public safety. There are several factors that impact safety. According to a Human Rights Watch’s report cited in the 2020 article A Roadmap for Re-imagining Public Safety in the United States: 14 Recommendations on Policing, Community Investment, and Accountability, high unemployment rates, low incomes, and lack of access to quality education and healthy foods are factors of poverty that “ increase the likelihood people will pursue illegal means of survival.”
So what do some of those factors look like in Philadelphia?
Each week this month, we will highlight data on a key factor impacting public safety.
June is Gun Violence Awareness Month, so Generocity will kick off this infographic series with crime statistics.
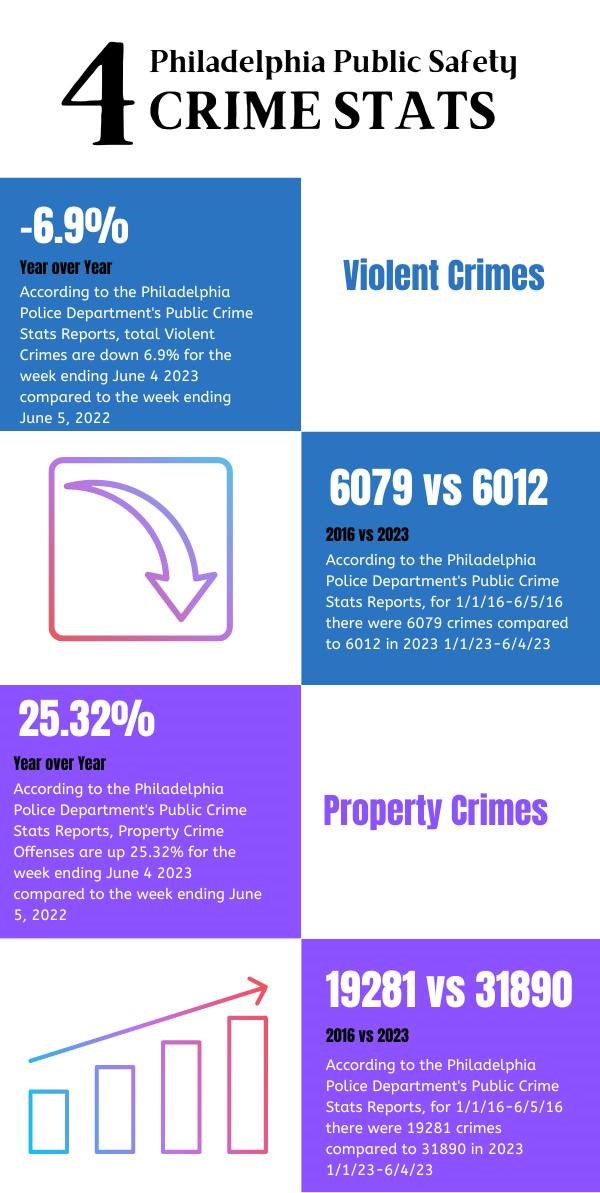
Issues such as COVID-19 and Social Unrests have impacted crime and poverty significantly. However while violent crimes are decreasing slightly year over year, historically crimes have been trending up. If crime is a factor of those in need pursuing illegal activity to survive, what responsibility do our civic and business leaders have to them and to our community to decrease that need and increase public safety?
What are your thoughts?
What data should we dive into as we engage in this series?
What solutions do you have to reduce crime in Philadelphia?
Project
Gun Violence & Public SafetyTrending News


Philadelphia's Fiscal Tapestry: Untangling the Challenges and Oversight to Provide Needed Services
Read More >
Homicides in Philadelphia Are Trending Downward. Will It Last?
Read More >